In today’s software development, quality assurance (QA) has solidified its position as an integral component to guarantee flawless software. The evolving landscape of websites and applications constantly necessitates more efficient QA measurements. This is where QA metrics come in to make QA processes more systematic and efficient!
In this article, we will delve into 12 absolute QA metrics and 7 derived QA metrics that will help you maximize the effectiveness of your test process and the productivity of the QA team.
QA Fundamentals: What is QA Testing
Quality Assurance (QA) in software development refers to the systematic process of ensuring that the final product meets specified requirements and standards. It involves comprehensive testing, identifying defects, and ensuring that the software functions smoothly before reaching the end users.
In the software development life cycle, QA plays a pivotal role. From the initial stages of requirement analysis to the final product launch, QA teams combine manual and automation testing methods to ensure the software aligns with the envisioned goals. They work closely with developers, detecting bugs and issues early, which minimizes costs and guarantees a higher-quality end product.
QA Metrics Fundamentals
What are QA metrics?
QA metrics are measurable standards used to measure and monitor the quality of the deliverables, processes, and outcomes.
For example, numbers of determined/passed/failed/blocked test cases.
QA metrics make QA processes more systematic and efficient. By quantifying key parameters such as test coverage, defect rates, productivity, and more, QA metrics aid in making informed decisions, mitigating risks, and continuously improving the software development process to align with QA goals and objectives.
Types of QA metrics
There are two major categories of software QA metrics: quantitative metrics (absolute number) and qualitative metrics (derived metrics).
- Quantitative metrics: Quantitative metrics are absolute numerical values that measure specific aspects like the number of defects found, the number of test cases executed, or the percentage of code coverage.
- Qualitative metrics: Qualitative metrics are derived numbers that evaluate the effectiveness and quality of processes and products. They involve analyzing trends, patterns, and data relationships to draw meaningful insights.
At LQA, our testing team excels in both categories, leveraging quantitative metrics for precise measurements and qualitative metrics for deeper insights into the overall software quality and testing effectiveness.

QA metrics for software success
Why Do QA Testing Metrics Matter?
Of course, a software quality assurance process can function without specific QA test metrics. Yet, the presence of precise QA metrics significantly elevates QA’s effectiveness and efficiency by providing measurable insights into the testing process and product quality.
QA metrics in agile empower project managers and decision-makers to
- allocate resources effectively,
- manage timelines,
- ensure a smoother development process.
These metrics enhance the software’s overall quality and streamline development workflows, leading to successful project outcomes.
Also read: Top countries for software quality assurance services
Types of Quantitative Metrics
Quantitative metrics, in particular, offer a clear and numerical insight into the various dimensions of the testing process, ranging from testing coverage to defect identification and overall efficiency.

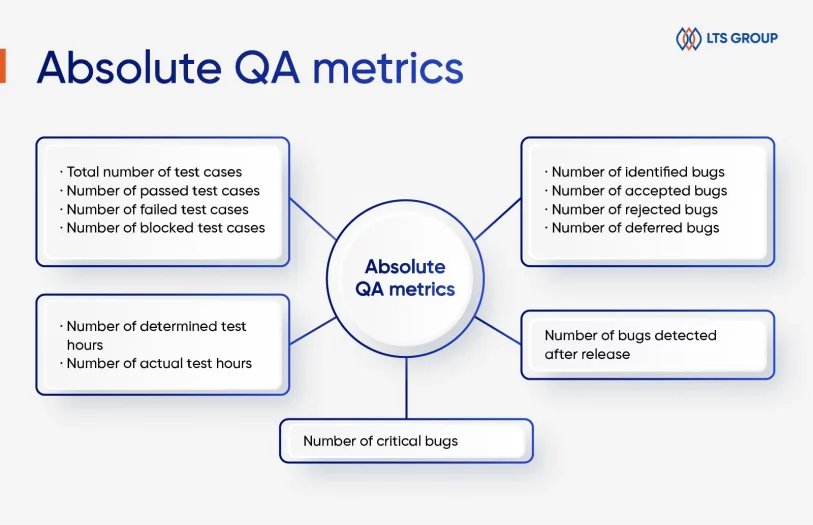
Top-used quantitative QA metrics examples include:
- Total number of test cases
- Number of passed test cases
- Number of failed test cases
- Number of blocked test cases
- Number of identified bugs
- Number of accepted bugs
- Number of rejected bugs
- Number of deferred bugs
- Number of critical bugs
- Number of determined test hours
- Number of actual test hours
- Number of bugs detected after release
Gain a practical guide to test case design with examples with our blog: Test case design techniques.
Types of Derived QA Metrics
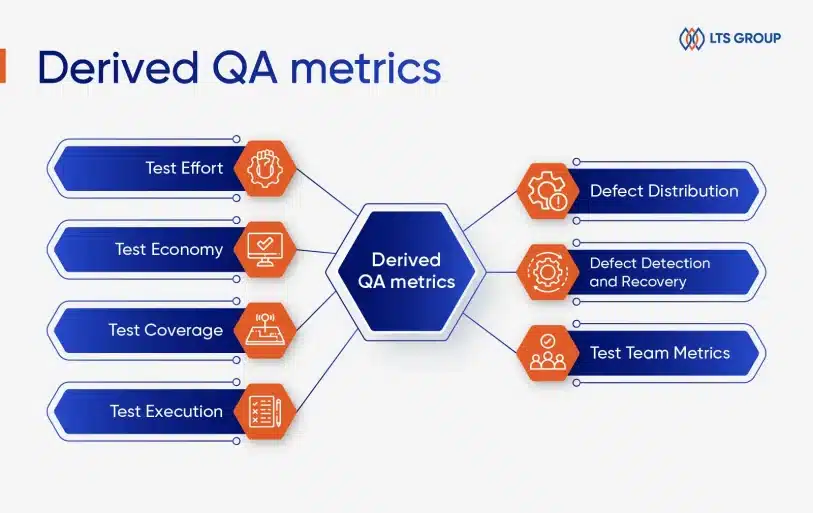
Derived QA metrics, a step beyond quantitative metrics, are derived from various quantitative data points collected during the software testing process.
At LQA, besides absolute numbers, we often implement derivative QA metrics to help clients get a better grip on the effectiveness and thoroughness of testing efforts.
Test coverage
Test coverage measures how much of the software has been tested. It ensures that all critical parts of the software are verified.
Below are common test coverage metrics:
- Percentage of code coverage: The proportion of lines of code tested compared to the total lines of code, reflecting the thoroughness of testing.
- Percentage of requirements coverage: The percentage of requirements addressed by test cases, indicating requirement validation.
- Percentage of critical paths tested: The critical paths executed out of the total possible paths in the software, revealing critical path coverage.
- Percentage of high-risk modules covered: The high-risk modules tested compared to the total high-risk modules identified, indicating risk mitigation.
- Percentage of interfaces tested: The interfaces tested compared to the total interfaces in the software, ensuring proper integration testing.
Test effort
Test effort metrics evaluate the human and time resources invested in various testing activities, providing insights into the efficiency and resource allocation.
Typical metrics to measure test effort:
- Total person-hours spent on testing: The sum of hours each team member has spent on testing, reflecting the overall effort invested.
- Average time to design a test case: The total time spent on test case design divided by the number of test cases designed, indicating design efficiency.
- Average time to execute a test case: The total time spent on test case execution divided by the number of test cases executed, revealing execution efficiency.
- Time spent on defect management: The total time spent on defect handling divided by the number of defects found, showing defect resolution efficiency.
- Time spent on test environment setup: The total time spent on setting up the test environment divided by the number of test cycles, indicating environment setup efficiency.
Test execution
Test execution metrics provide an overview of completed tests and those awaiting execution. When recording test results, testers often classify them as passed, failed, or blocked.
Typical metrics for test execution:
- Number of test cases executed: The total count of test cases executed during a testing phase, reflecting the scope of testing.
- Execution time per test case: The total execution time divided by the number of test cases executed, indicating the efficiency of test case execution.
- Number of test cases automated: The count of test cases automated out of the total, revealing automation coverage.
- Number of passed/failed test cases: The count of test cases passed or failed, indicating test success.
- Number of test case iterations: The number of times a test case is repeated or iterated, revealing reusability and robustness of the test case.
Defect distribution
Defect distribution metrics provide insights into the distribution of defects across different mediums. Hence, aiding in identifying common sources for potential improvement.
Here are common defect distribution metrics:
- Number of defects per module/component: The count of defects identified in each module or component, aiding in defect prioritization and resource allocation.
- Defects categorized by severity: The count of defects categorized by severity levels such as critical, major, and minor, aiding in priority-based resolution.
- Defects categorized by functionality: The count of defects categorized by functionality like UI, database, and security, aiding in targeted testing.
- Number of defects by testing phase: The count of defects detected in different testing phases like unit testing and system testing, aiding in process evaluation.
- Defect distribution by cause: Defect distribution by cause involves categorizing defects based on their origin or cause, providing insights into areas for improvement.
Defect detection and recovery
Defect detection and recovery metrics measure the efficiency of defect detection and the speed of recovery processes, ensuring effective defect resolution.
Here are useful metrics for defect detection and recovery:
- Defects found per hour of testing: The count of defects identified per hour of testing, reflecting detection efficiency.
- Average time taken to detect a defect: For example, if it took 100 hours to detect 20 defects, the average time to detect a defect is 100/20= 5 hours. Moreover, for a quick and accurate average of the time use the average calculator by Allmath without using any formula.
- Time taken to recover from a defect: The time taken to recover or resolve a defect, reflecting defect resolution efficiency.
- Number of retests after defect fixes: The count of retests conducted after defect fixes, indicating the need for revalidation.
- Defect reoccurrence rate: The percentage of defects that reoccur after being marked as resolved, indicating the stability of defect resolution.
Test team metrics
Test team metrics assess the productivity, efficiency, and performance of the testing team, aiding in team management and resource allocation.
Here are popular QA metrics to evaluate a test team:
- Team productivity: The rate at which test cases or components are developed or executed by the team members, reflecting team efficiency.
- Number of defects logged by each team member: The count of defects logged by each team member, aiding in defect tracking and individual performance evaluation.
- Test case execution rate per team member: The rate at which test cases are executed by each team member, indicating execution efficiency.
- Number of test environments set up by each team member: The count of test environments set up by each team member, reflecting efficiency in environment management.
- Defects validated per team member: The count of defects validated or verified by each team member, indicating validation efficiency.
Test economy
Test economy provides insights into the cost-effectiveness and financial aspects of the testing process, aiding in budgeting and cost optimization.
Below are commonly used test economics metrics:
- Cost per test case: The cost incurred for testing each test case, aiding in cost allocation and optimization.
- Total cost of testing per module/component: The total cost incurred for testing each module or component, aiding in budgeting and resource allocation.
- Cost per defect found and fixed: The cost incurred for finding and fixing each defect, aiding in defect management efficiency.
- Return on investment (ROI) of testing efforts: The ratio of the benefits gained from testing efforts to the cost invested in testing, reflecting the effectiveness of testing.
- Cost of testing as a percentage of the total project cost: The percentage of the total project cost attributed to testing, aiding in project budgeting and financial planning.
These quantitative QA metrics provide measurable data corresponding to each derivative QA metric, allowing for a comprehensive assessment of the testing process.
Frequently Asked Questions for QA Metrics
1. What are quality standards for QA?
Quality standards for QA involve predefined criteria and benchmarks that a product or process must meet to ensure its quality.
These standards can encompass various aspects such as functionality, reliability, performance, usability, security, and compliance with industry regulations. They provide a clear framework for evaluating and assuring the quality of software throughout the development life cycle.
2. How do you measure quality in QA?
Measuring quality in QA involves a comprehensive evaluation of the software against predefined quality standards. This assessment is facilitated through a variety of quantitative and qualitative metrics in this blog.
Quantitative metrics include aspects like the number of defects, test coverage, and performance metrics. Qualitative metrics involve assessing user experience, feedback, and adherence to design guidelines.
A combination of these metrics offers a holistic view of the software’s quality.
3. How is QA productivity measured?
QA productivity is measured through various quantitative metrics that evaluate the efficiency and effectiveness of the QA process. These metrics include:
- the number of test cases executed
- defects detected
- test coverage achieved
- time taken for testing.
- person-hours spent on testing
- test case execution rates
Final Thoughts on QA Metrics
QA metrics help managers estimate the efficiency and effectiveness of test procedures. Embracing both quantitative and qualitative metrics yields a multitude of benefits. From cost-efficiency and resource optimization to product-market fit assurance, these metrics align development efforts with strategic goals.
Have an idea of outsourcing software testing in mind? Our insights will help:


